Nugget Casino: Daily Coin-In Modeling
End-to-end pipeline: exploratory analysis, spatial clustering, feature engineering, model training (RF / XGBoost / LightGBM), SHAP explainability, and optimization.
Model
Random Forest
Best R²
0.9342
Typical Error
~$15 on ~$300/day
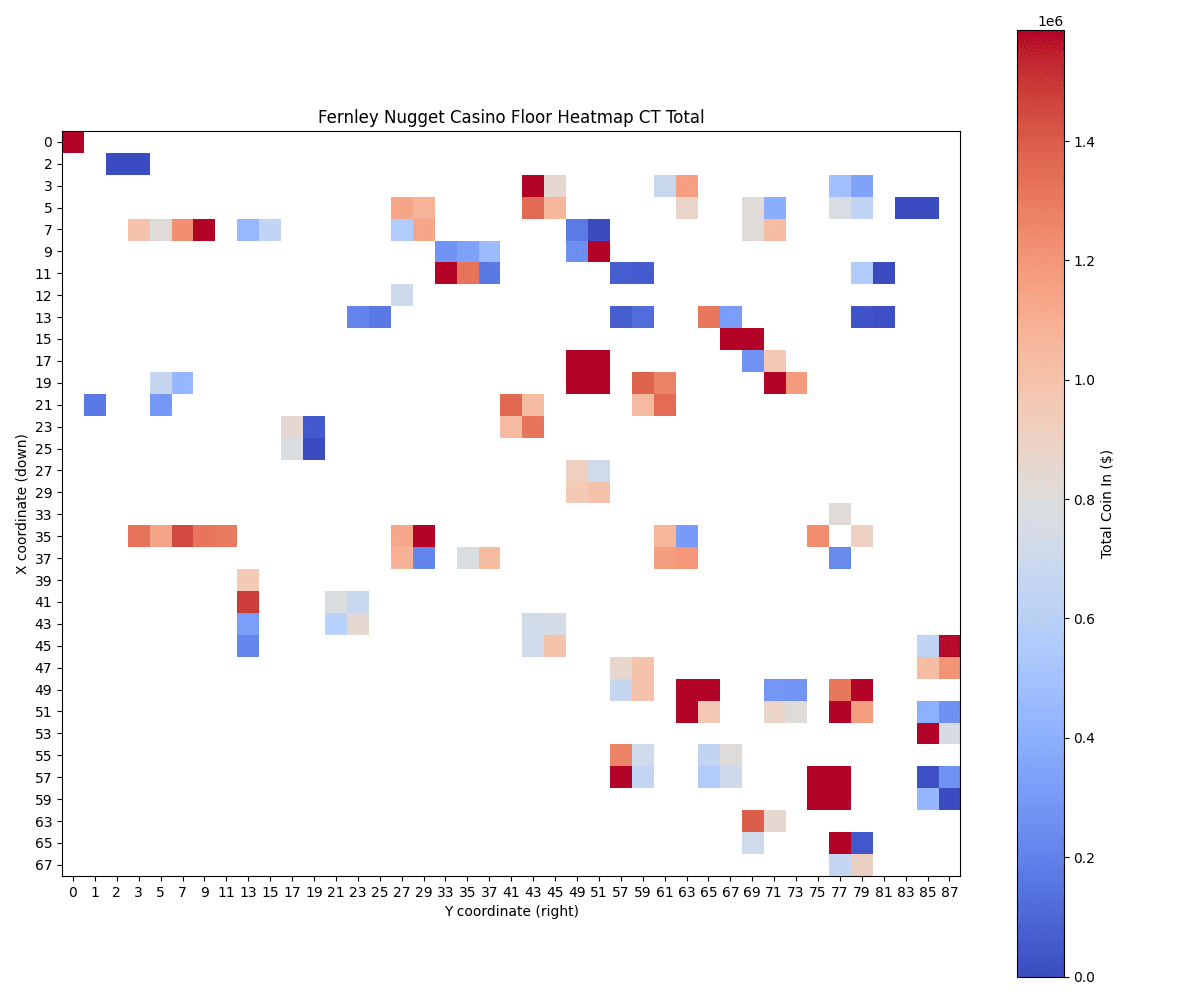
1) Exploratory Analysis: Daily Coin-In Heatmaps
I started by visualizing daily coin-in at the machine level to understand spatial and behavioral patterns across the floor. This helped confirm that “where a machine is placed” has strong signal.
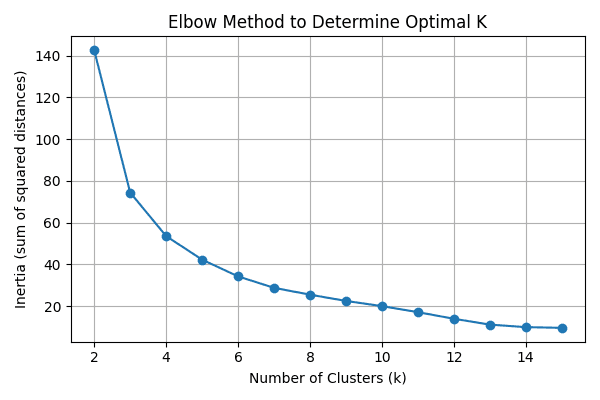
2) Choosing K: Elbow Method
To discretize the floor into spatial regions, I used the elbow method to choose an appropriate number of clusters. I selected K = 13 where the marginal gain in inertia reduction leveled off.
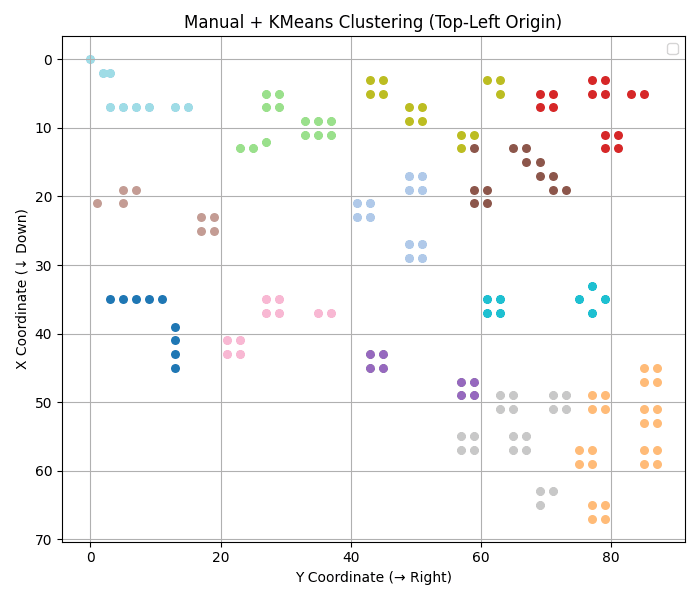
3) Spatial Clustering: K-Means on Machine Locations
I ran K-means on machine coordinates to assign each machine a spatial cluster. These clusters became categorical features (and helped define proximity features) used in the supervised model.
4) Feature Engineering
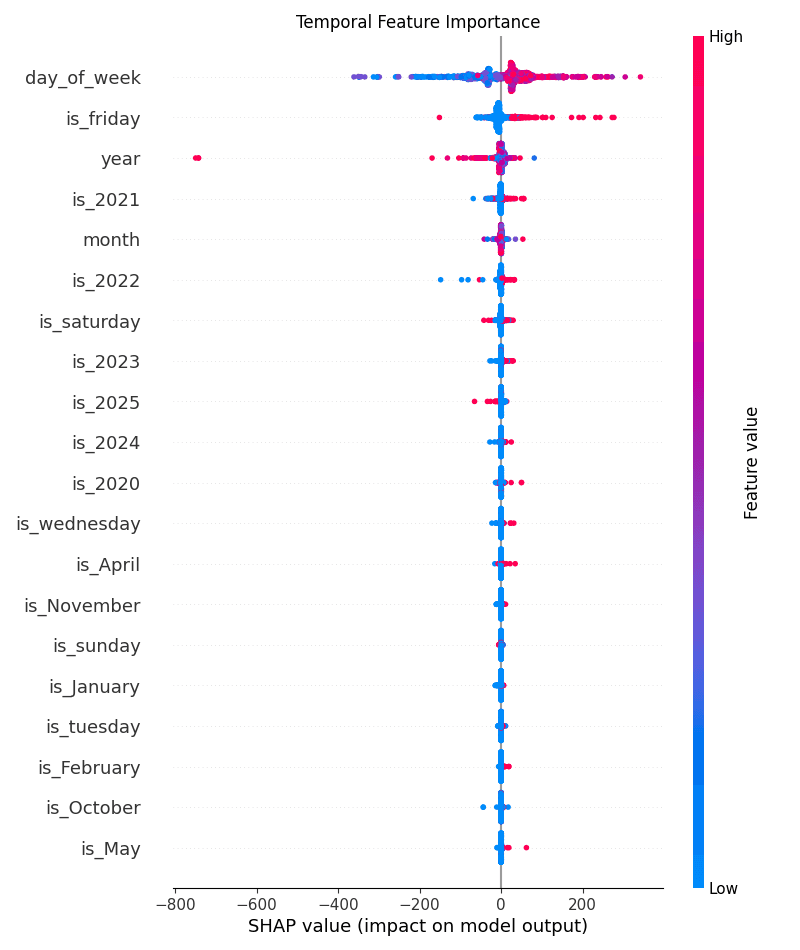
- Temporal: day-of-week, weekend flag, holiday flag.
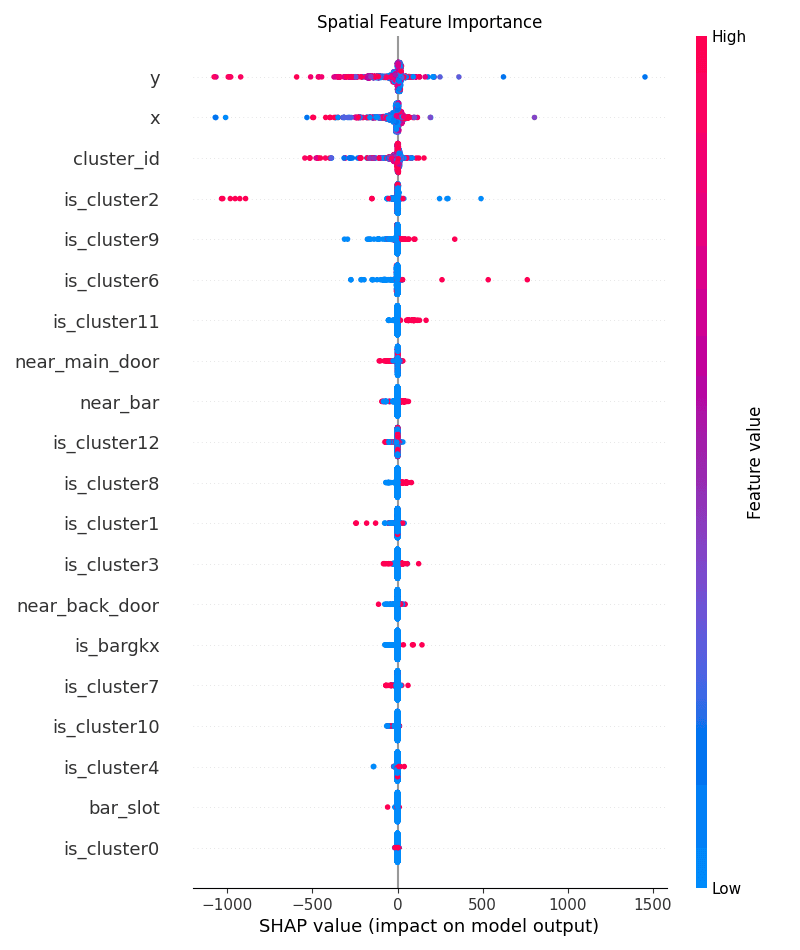
- Spatial: near door, near restroom, bar area, cluster id, proximity proxies.
- Machine: one-hot encoding for game type / cabinet / denomination categories.
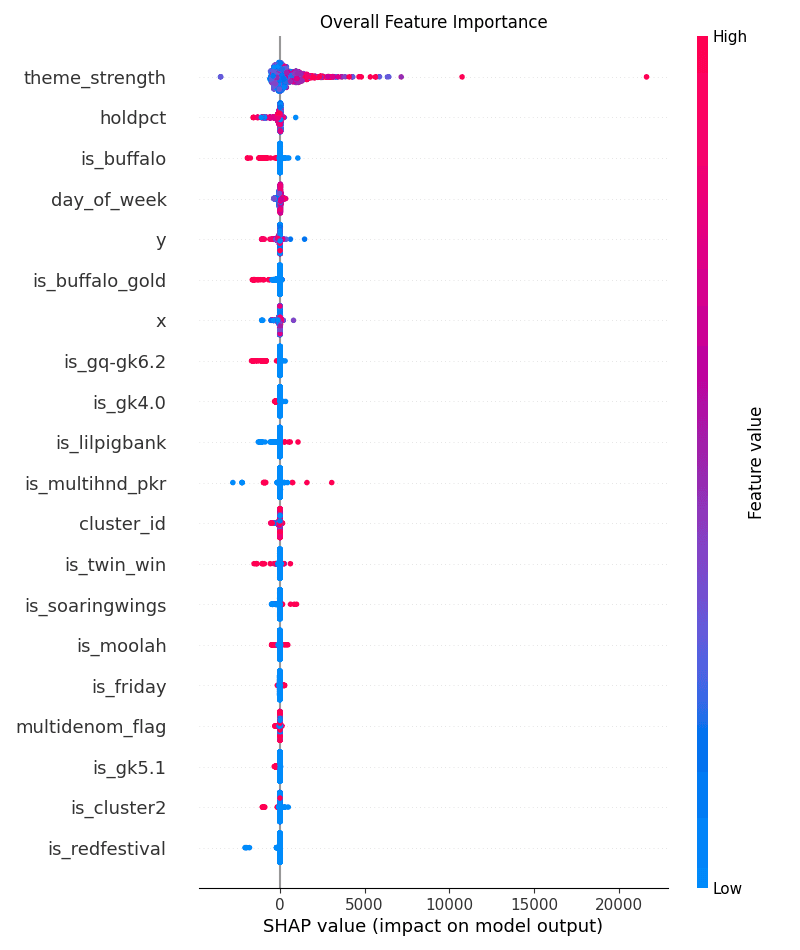
- Leakage-aware “machine strength”: engineered a historical-performance feature while avoiding direct leakage from the target day.
I used SHAP to interpret which features actually drove predictions overall, and then zoomed in on the most important spatial vs temporal drivers.
5) Model Training: RF vs XGBoost vs LightGBM
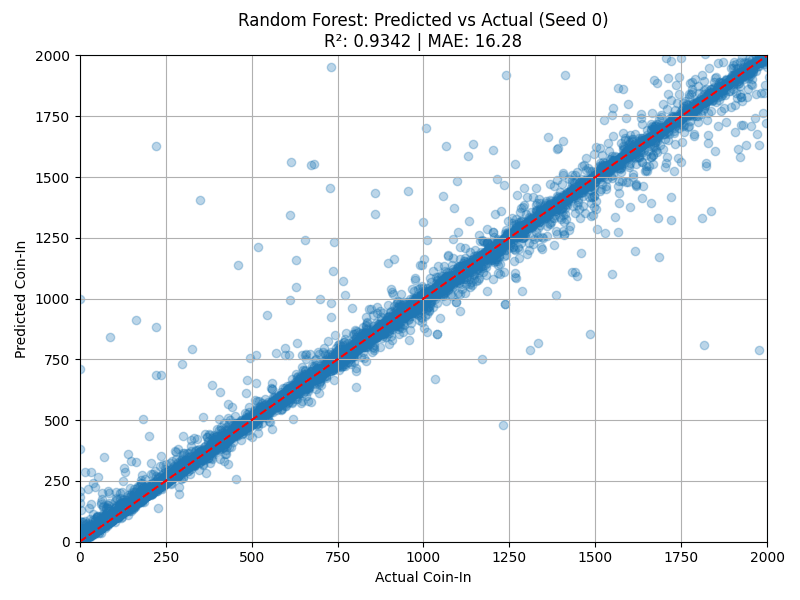
I trained and evaluated Random Forest, XGBoost, and LightGBM. The initial comparison plot is “zoomed out” because it shows the entire target range across all machines and days.
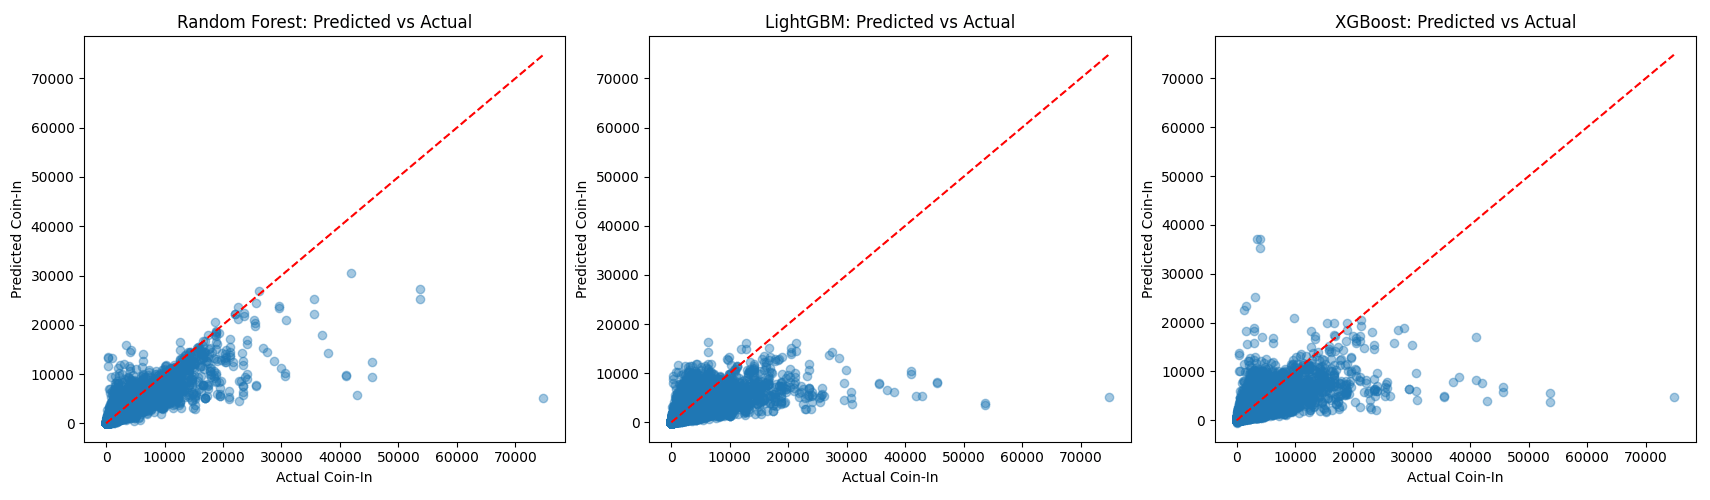
6) Random Forest: Best Performance (R² = 0.9342)
The Random Forest performed best with R² = 0.9342. In the most common daily coin-in range, predictions were typically within about $15 on an average of roughly $300 per day, which was strong enough to support layout optimization experiments.